

SynchroniCity Round Up: Dublin
Background
Over ten weeks from mid June to August 2019, 200 cyclists in Dublin contributed their ride insights as part of the See.Sense Smart Cycling project, facilitated through the EU SynchroniCity initiative. You can find out more about the See.Sense Smart Cycling project here.
What ride insights were shared?
Project participants purchased a discounted See.Sense ACE bicycle light and opted in to share their ride insights with the project which included a mixture of quantitative sensor data (speed, road surface quality, swerving etc) and qualitative data in the form of geolocated survey feedback shared via an in-app survey.
SEE.SENSE COLLECTS STANDARDISED DATA SET ON RIDE INSIGHTS

Who was on the project?
Over 730 applications to join the project were received. Of the 200 who were successful in their application, 97% of these were commuter cyclists and 83% cycled on a daily basis with the remainder cycling at least once a week.
PARTICIPANT POOL - DUBLIN

What did we find out?
The following section contains a number of high level snapshots of ride insights shared through the project. For the most part the insights within these images have been heavily aggregated with one single average value representing the insights collected within a 10metre x 10metre square, these values are then only visualised if 3 or more distinct project participants have cycled within that square.
Mapping route popularity
Over the course of the project the routes running adjacent to the Liffey and the Grand Canal Corridor proved the most frequented routes in the city.

Mapping average speeds

Relatively higher speeds can be seen on the outskirts of the city centre with lower speeds for the most part experienced in the inner city.

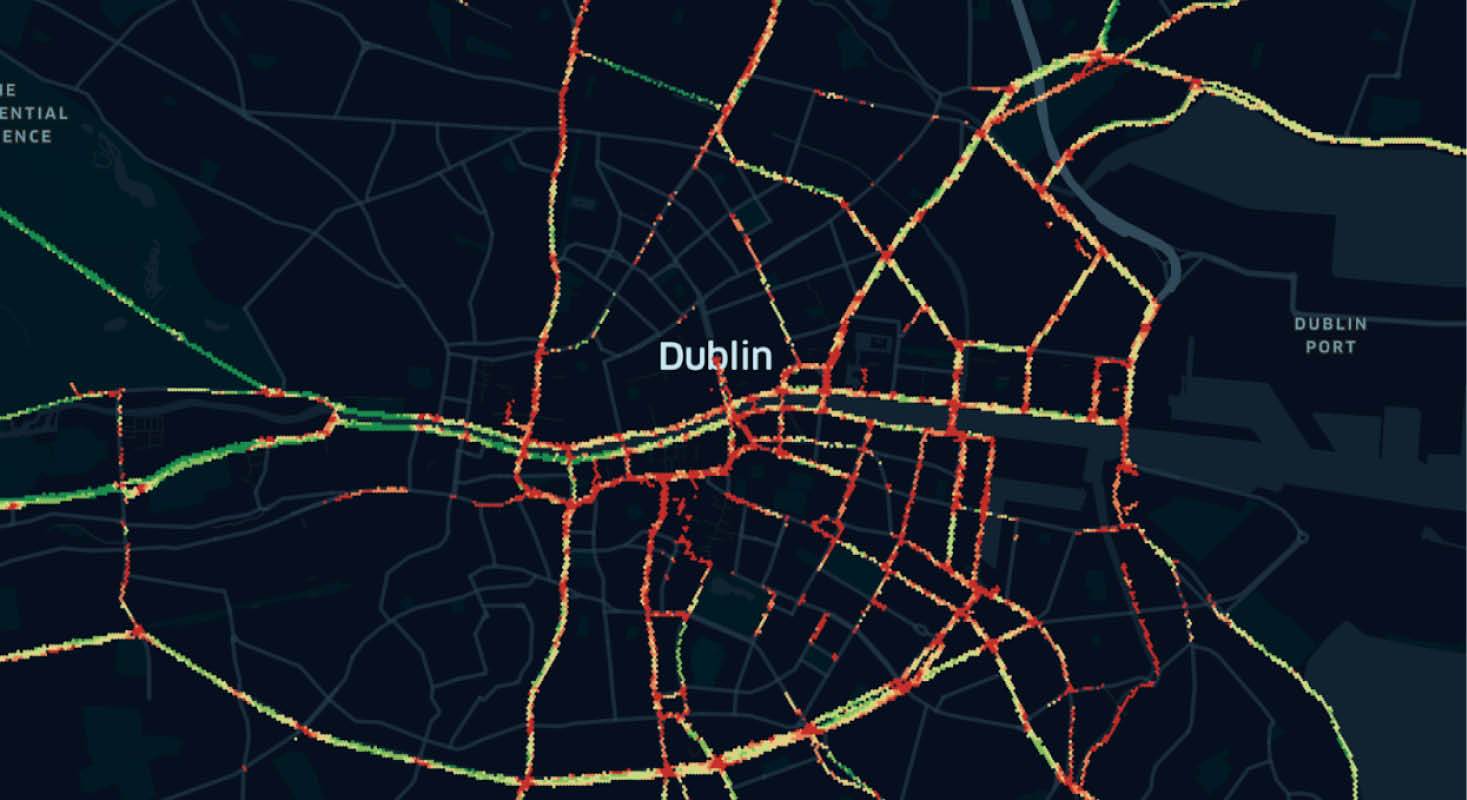
Mapping road surface quality

The graphic below highlights the top 20% of values on the See.Sense surface roughness index

What you told us
Through the project geolocated post ride surveys were submitted. These contained qualitative insights into the experience of cycling in Dublin, highlighting issues like close passes, collisions, potholes and obstructions.

How do different groups cycle?
Through the See.Sense app, participants were able to create a profile to share information on Gender, Age and type of bicycle (e-bike vs ‘normal’ bike). In Dublin we found that male participants were, on average, travelling more quickly than their female counterparts with a correlating pattern in the amount of sudden braking. Male participants were also, on average, travelling on rougher roads through the project. However, participants identifying as female experienced a higher level of swerving while riding through the city.

Next Steps

We’d like to thank all 200 of our participants for joining our second smart cycling project in Dublin. We’re truly grateful for your continued support. We are currently exploring next steps with the City Council, using these ride insights to make cycling better in the city.