

SynchroniCity Round Up: Manchester
Background
Over ten weeks from mid June to August 2019, 200 cyclists in Manchester contributed their ride insights as part of the See.Sense Smart Cycling project, facilitated through the EU SynchroniCity initiative. You can find out more about the See.Sense Smart Cycling project here.
What ride insights were shared?
Project participants purchased a discounted See.Sense ACE bicycle light and opted in to share their ride insights with the project which included a mixture of quantitative sensor data (speed, road surface quality, swerving etc) and qualitative data in the form of geolocated survey feedback shared via an in-app survey.
See.Sense Collects Standardised Data Set On Ride Insights

Who was on the project?
Over 600 applications to join the project were received. Of the 200 who were successful in their application, 82% of these were commuter cyclists and 83% cycled on a daily basis with the remainder cycling at least once a week.
Participant Pool - Manchester

What did we find out?
The following section contains a number of high level snapshots of ride insights shared through the project. For the most part the insights within these images have been heavily aggregated with one single average value representing the insights collected within a 10metre x 10metre square, these values are then only visualised if 3 or more distinct project participants have cycled within that square.
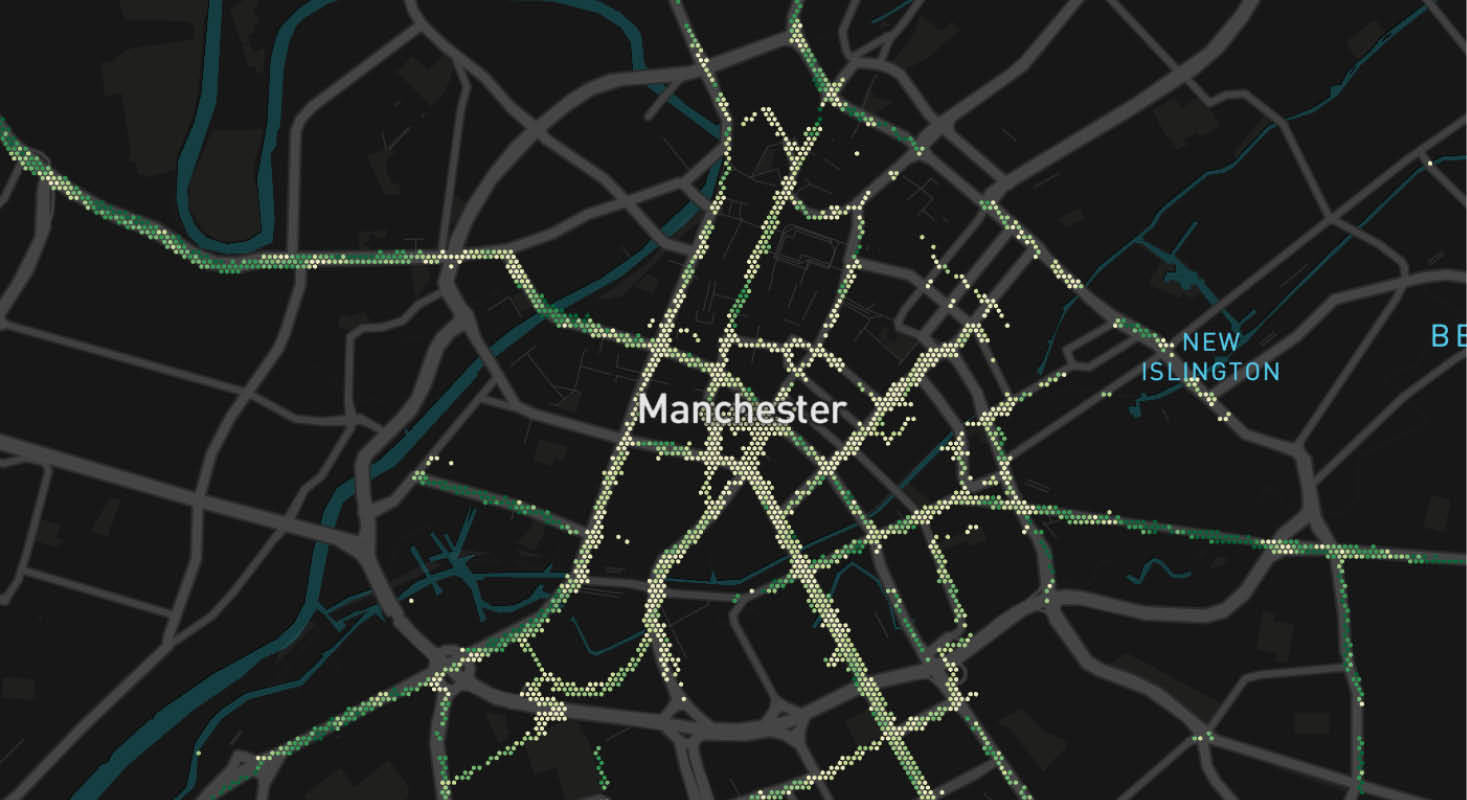
Mapping route popularity
Over the course of the project the Oxford Road corridor proved the most popular route in the city.

Mapping average speeds
Relatively higher speeds can be seen on the outskirts of the city centre with lower speeds for the most part experienced in the inner city.

MAPPING ROAD SURFACE QUALITY
The graphic below highlights the top 20% of values on the See.Sense surface roughness index.

What is the experience of cycling in Manchester?
We were able to create heatmap visualisations of areas showing high levels of heavy braking and/or swerving. Along the segregated cycling lanes of the Oxford Road corridor for example, our project participants are travelling relatively consistently. However some higher values for heavy braking can be seen in the north bound lane at the junction of Oxford Road and Hulme Street. Similarly, the difference in levels of ‘swerve’ seen within the two parallel streets of Princess St and Sackville St drew our attention with one seeing high levels of swerving (with the exception of a portion of the south bound section containing a cycling lane highlighted by the pink data points) and the other showing lower levels of swerve along its length.
Understanding Cycling Experience - Quantitative
 What you told us
Through the project, 120 geolocated post ride surveys were submitted. These contained qualitative insights into the experience of cycling in Manchester, highlighting issues like close passes, collisions, potholes and obstructions.
Understanding Cycling Experience - Qualitative

How do different groups cycle?
Through the See.Sense app, participants were able to create a profile to share information on Gender, Age and type of bicycle (e-bike vs ‘normal’ bike). In Manchester we found that male participants were, on average, travelling more quickly than their female counterparts with a correlating pattern in the amount of sudden braking. Male participants were also, on average, travelling on rougher roads through the project.

Next Steps
We’d like to thank all 200 of our participants for joining our second smart cycling project in Manchester. We’re truly grateful for your continued support. We are currently exploring next steps with the City Council, using these ride insights to make cycling better in the city.

With Manchester council's executive member for the environment, planning and transport Angeliki Stogia, said:
“The picture we’re building up through these trial schemes will give us a more complete understanding of how people are navigating across the city centre by bike. This information will feed into our plans to invest significantly in improving our infrastructure for people who want to be able to travel on foot and by bike and help to ensure that this investment is targeted successfully. Getting this right is crucial to our city’s plans for becoming carbon neutral before 2038.”
We are currently exploring next steps with the City Council, using these ride insights to make cycling better in the city.